
chart.heatmap
Heatmap chart
Exact grouped matrix values with cell, row, column, and grid interaction.
- Exact variations
- 1
- Surfaces
- 2
Explore the generated output
Choose a real-world variation and surface. The preview and interactive state come directly from the certified skill output; the website does not redraw or alter the chart.
Regional commercial intensity
Dense (heatmap) chart. 4 rows × 4 columns, sequential scale from 0.00 to 0.90. Cells: North/Q1 0.9, North/Q2 0.4, North/Q3 0.2, North/Q4 0.1, South/Q1 0.3, South/Q2 0.8, South/Q3 0.5, South/Q4 0.2, East/Q1 0.1, East/Q2 0.3, East/Q3 0.7, East/Q4 0.6, West/Q1 0, West/Q2 0.2, West/Q3 0.4, West/Q4 0.9. All values are listed.
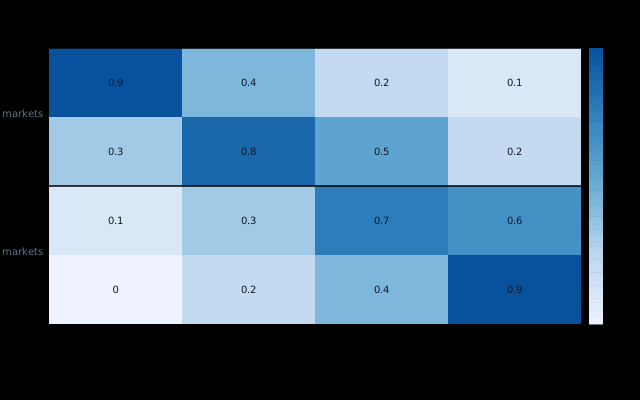
Dense (heatmap) chart. 4 rows × 4 columns, sequential scale from 0.00 to 0.90. Cells: North/Q1 0.9, North/Q2 0.4, North/Q3 0.2, North/Q4 0.1, South/Q1 0.3, South/Q2 0.8, South/Q3 0.5, South/Q4 0.2, East/Q1 0.1, East/Q2 0.3, East/Q3 0.7, East/Q4 0.6, West/Q1 0, West/Q2 0.2, West/Q3 0.4, West/Q4 0.9. All values are listed.
Static chart preview shown.
Inspect before you invoke
Ask Squillify for the live, versioned contract before constructing an input. That keeps your agent aligned with the chart-specific schema, limits, supported behavior, and recovery guidance.
GET /v1/runtime/skills/chart.heatmap/contractDesigned defaults, precise customization
Theme, surface, and density
Start from the Neutral baseline or choose one of nine additional predefined style foundations. Each coordinates color, typography, spacing, and chart chrome.
Palettes and semantic tokens
Apply approved categorical, sequential, or diverging paint while retaining stable data identity and meaning.
Typed, scoped rules
Target supported chart roles, series, categories, points, or meanings with validated paint, shape, and emphasis controls.
Bounded paint-only CSS
Use sanitized, chart-scoped CSS for final decoration without changing layout, measurement, data, or grammar.