
Squillify Chart Skills
Exact charts. Ready on the first call.
Give your agents focused chart skills that turn structured data into polished, deterministic SVG. Every current demo below is an exact generated output—not a hand-drawn mockup—with a complete static form and certified interactive behavior where supported.
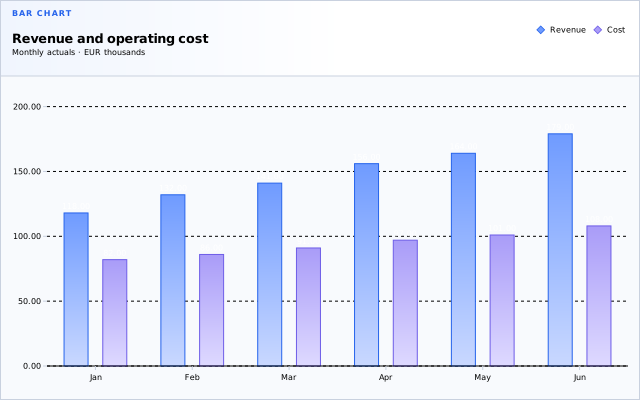
Revenue and operating cost
Bar chart. 2 series across 6 categories, grouped, vertical. Revenue: Jan 118, Feb 132, Mar 141, Apr 156, May 164, Jun 179. Cost: Jan 82, Feb 86, Mar 91, Apr 97, May 101, Jun 108. All values are listed.
Bar chart. 2 series across 6 categories, grouped, vertical. Revenue: Jan 118, Feb 132, Mar 141, Apr 156, May 164, Jun 179. Cost: Jan 82, Feb 86, Mar 91, Apr 97, May 101, Jun 108. All values are listed.
Static chart preview shown.
Useful out of the box
Carefully designed defaults, light and dark surfaces, readable labels, and real-world examples make every supported chart immediately presentable.
Interactive without hidden code
The chart remains a complete static SVG. A trusted, digest-pinned host adds only the motion and interactions declared by its certified behavior artifact.
Built for agent reliability
Each narrow chart skill validates its own grammar, preserves exact data semantics, and refuses unreadable requests instead of silently sampling or changing the story.
Scope
What you can explore now
Designed defaults, precise customization
Start with a coherent result immediately, then adapt only the parts your product needs. Customization stays typed, bounded, and separate from the chart's analytical grammar.
Theme, surface, and density
Start from the Neutral baseline or choose one of nine additional predefined style foundations. Each coordinates color, typography, spacing, and chart chrome.
Palettes and semantic tokens
Apply approved categorical, sequential, or diverging paint while retaining stable data identity and meaning.
Typed, scoped rules
Target supported chart roles, series, categories, points, or meanings with validated paint, shape, and emphasis controls.
Bounded paint-only CSS
Use sanitized, chart-scoped CSS for final decoration without changing layout, measurement, data, or grammar.
Predefined style foundations
Neutral by default. More visual voices when context calls for them.
Every supported chart also works with nine additional predefined style foundations. They adapt presentation for different settings while preserving the same chart grammar, exact values, accessibility, and certified behavior.
- Formal
- Operations dashboard
- Scientific document
- Modern startup
- Corporate presentation
- +4 more
Explorer
Find the right chart skill
Search the certified demo catalog by chart, skill identifier, or use case.
Showing 12 of 27 matching skills
Bar
chart.bar
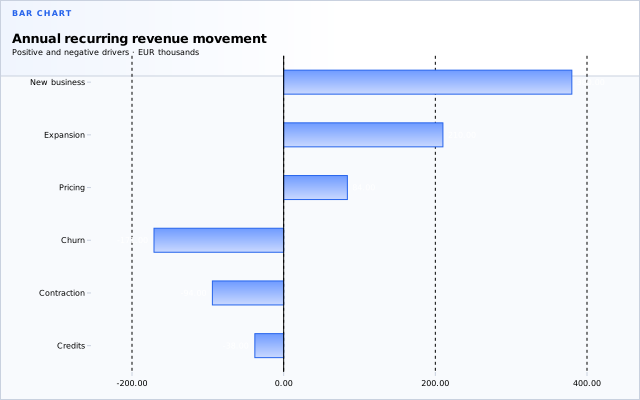
Grouped commercial actuals, stacked regional contribution, and horizontal signed ARR movement.
3 variationslight preview- Motion
- Interactive
- Keyboard
Heatmap
chart.heatmap
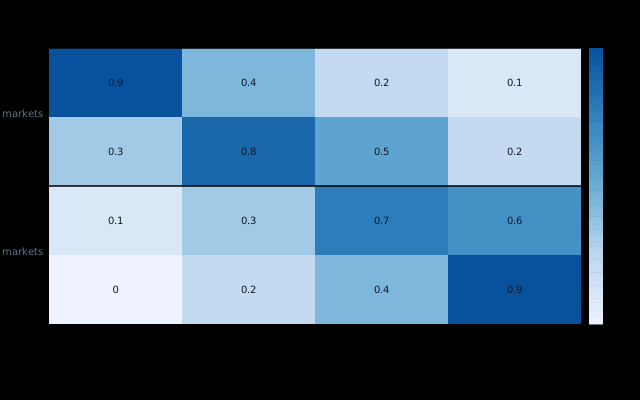
Exact grouped matrix values with cell, row, column, and grid interaction.
1 variationlight preview- Motion
- Interactive
- Keyboard

Scatter
chart.scatter
Exact grouped quantitative observations without sampling or inferred statistics.
1 variationlight preview- Motion
- Interactive
- Keyboard
Bubble
chart.bubble
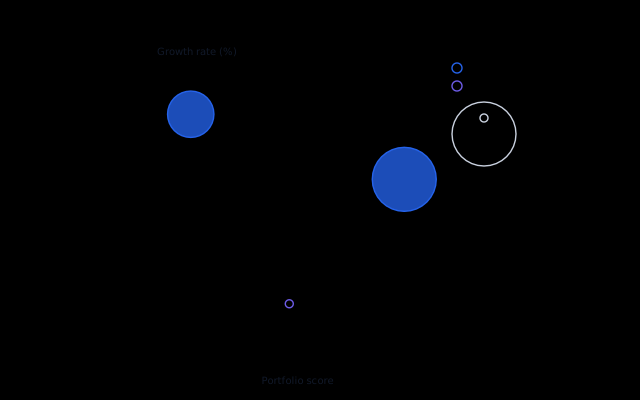
Exact position and circle-area encoding with labelled axes and a visible zero.
1 variationlight preview- Motion
- Interactive
- Keyboard
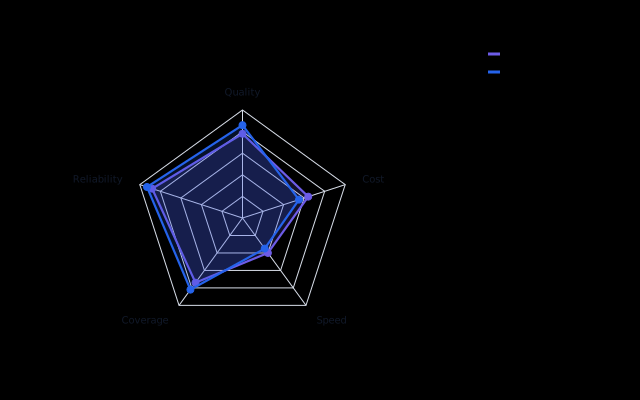
Radar
chart.radar
Complete operating profiles across five independent exact domains.
1 variationlight preview- Motion
- Interactive
- Keyboard
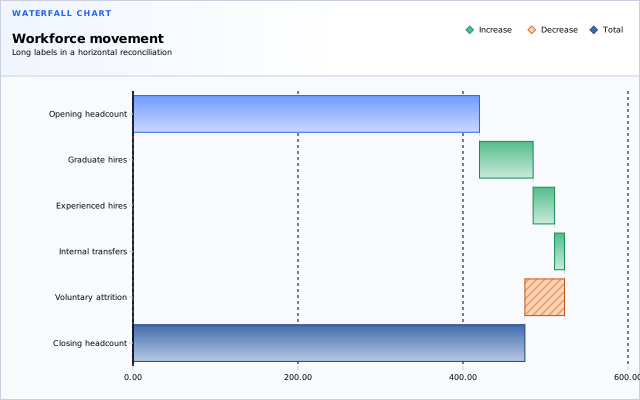
Waterfall
chart.waterfall
Validated margin bridge, explicit subtotal with contributors, and horizontal workforce reconciliation.
3 variationslight preview- Motion
- Interactive
- Keyboard
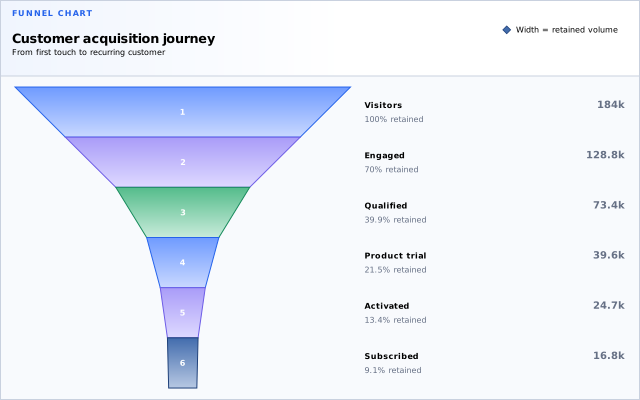
Funnel
chart.funnel
Customer acquisition, horizontal hiring conversion, and target-aware expansion with explicit increases.
3 variationslight preview- Motion
- Interactive
- Keyboard

Sankey
chart.sankey
Exact value-proportional conversion flows with balance and route tracing.
1 variationlight preview- Motion
- Interactive
- Keyboard
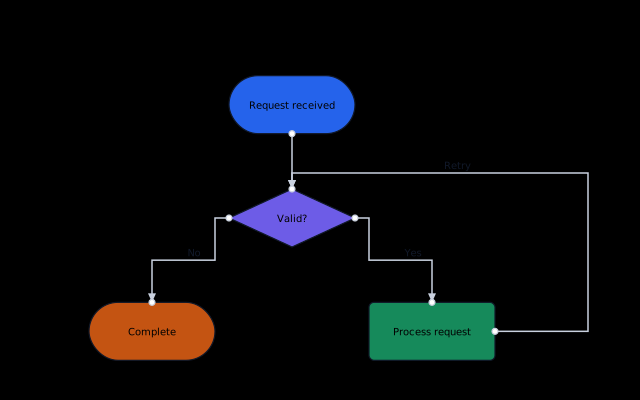
Flowchart
chart.flowchart
Typed process nodes with labelled decisions, explicit ports, arrows, merges, and loop routing.
1 variationlight preview- Motion
- Interactive
- Keyboard

Line
chart.line
Eight domains, curves, gaps, bands, indexing, dense signals, and exact floating inspection.
8 variationslight preview- Motion
- Interactive
- Keyboard
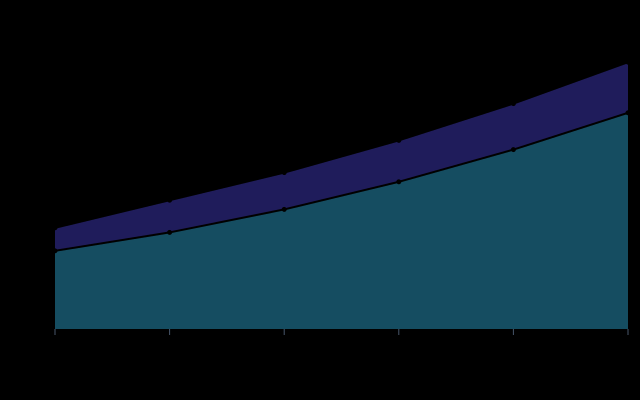
Area
chart.area
Demand magnitude, explicit temperature baseline, and unstacked regional adoption.
3 variationslight preview- Motion
- Interactive
- Keyboard

Stacked Area
chart.stacked_area
Absolute cloud spend, normalized revenue mix, and sign-separated net movement.
3 variationslight preview- Motion
- Interactive
- Keyboard